
I recently tried introducing go generics for my cuckoofilter implementation. Unfortunately I ran into some performance regressions.
name             old time/op  new time/op  delta
Filter_Reset-4   2.58µs ± 4%  2.51µs ± 8%     ~     (p=0.151 n=5+5)
Filter_Insert-4  37.8ns ± 7%  43.1ns ± 3%  +14.00%  (p=0.008 n=5+5)
Filter_Lookup-4  37.7ns ± 6%  46.2ns ± 2%  +22.43%  (p=0.008 n=5+5)
Here’s the process how I debugged it. First, I made sure to use the most recent go version.
gotip download
Then I grabbed a profile for both versions of the code.
git checkout master
gotip test -bench=Filter_Lookup -cpuprofile=master_gotip.profile --benchtime=60s
git checkout generic_fp_type
gotip test -bench=Filter_Lookup -cpuprofile=generic_gotip.profile --benchtime=60s
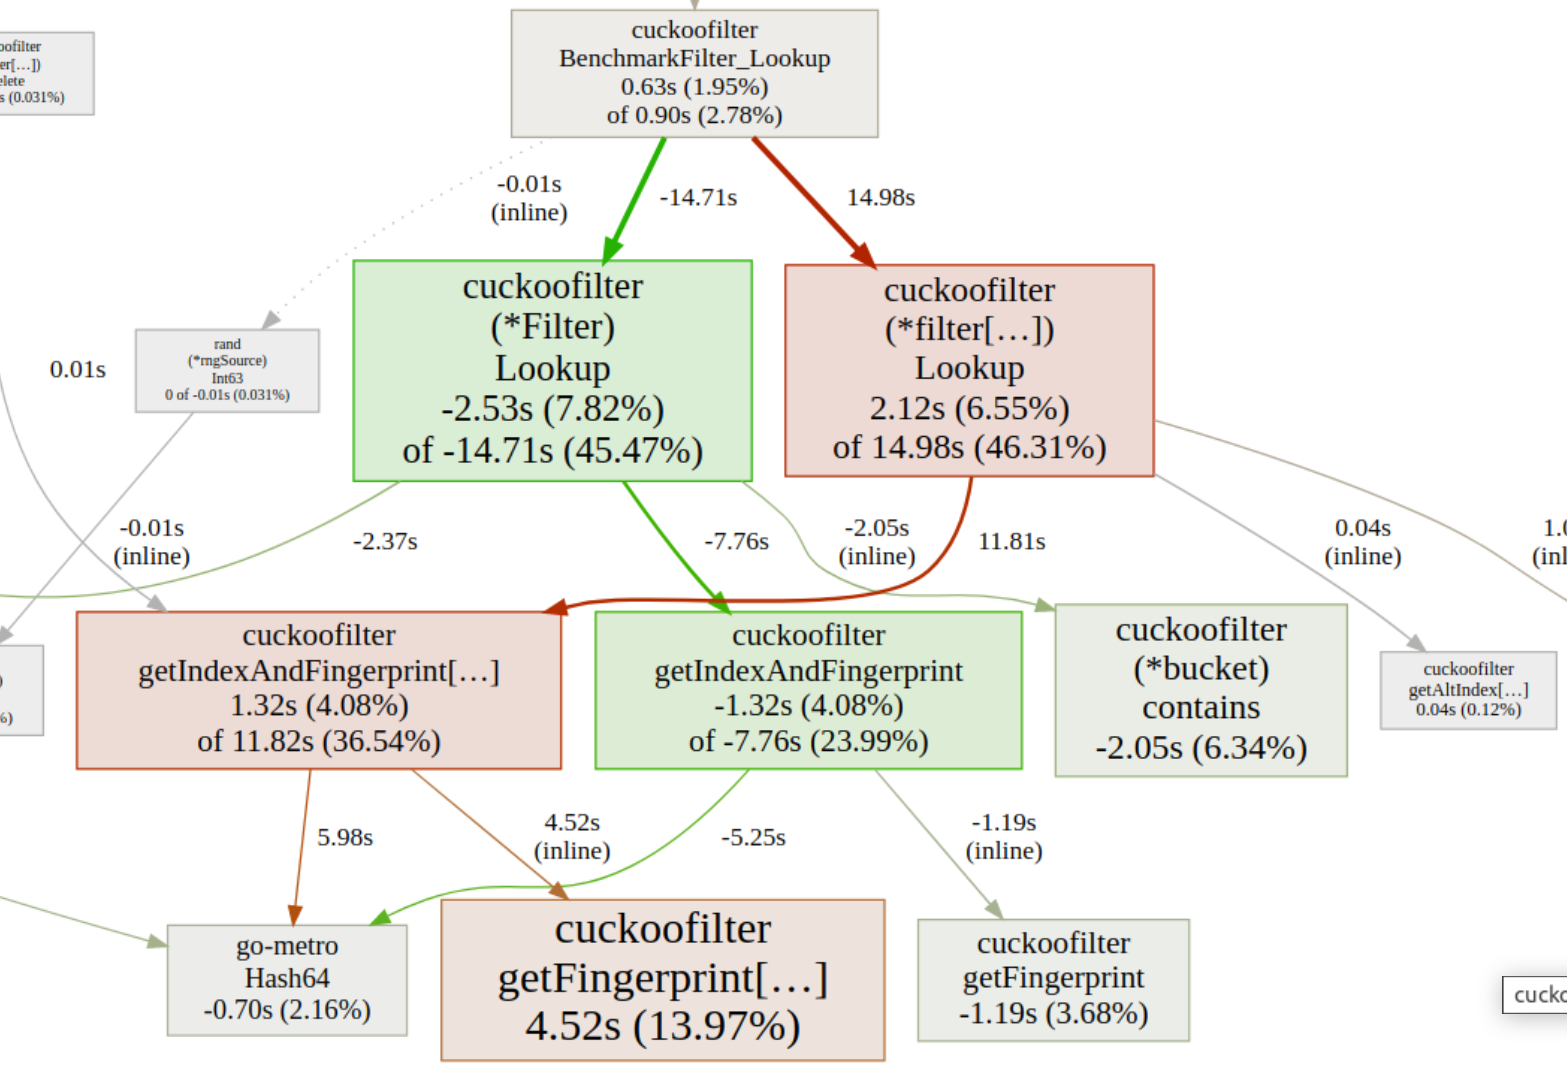
Then its time to fire up pprof with the -base flag and --web to get a basic overview of where my code spends more time.
go tool pprof -base=master_gotip.profile generic_gotip.profile --web
There I ran into another complication: With switching to generics, the function names the profiling samples
are attributed to are slightly different: They now include [...] at the end.
Instead of matching equivalent nodes in the base profile, to the profiler it seems as if the whole code flow changed.
While its not impossible to work with this, I decided to write a small helper tool that should clean this up. It mutates the profile so it becomes more comparable to before generics. The centerpiece is
for _, f := range prof.Function {
    f.Name = strings.ReplaceAll(f.Name, "[...]", "")
}
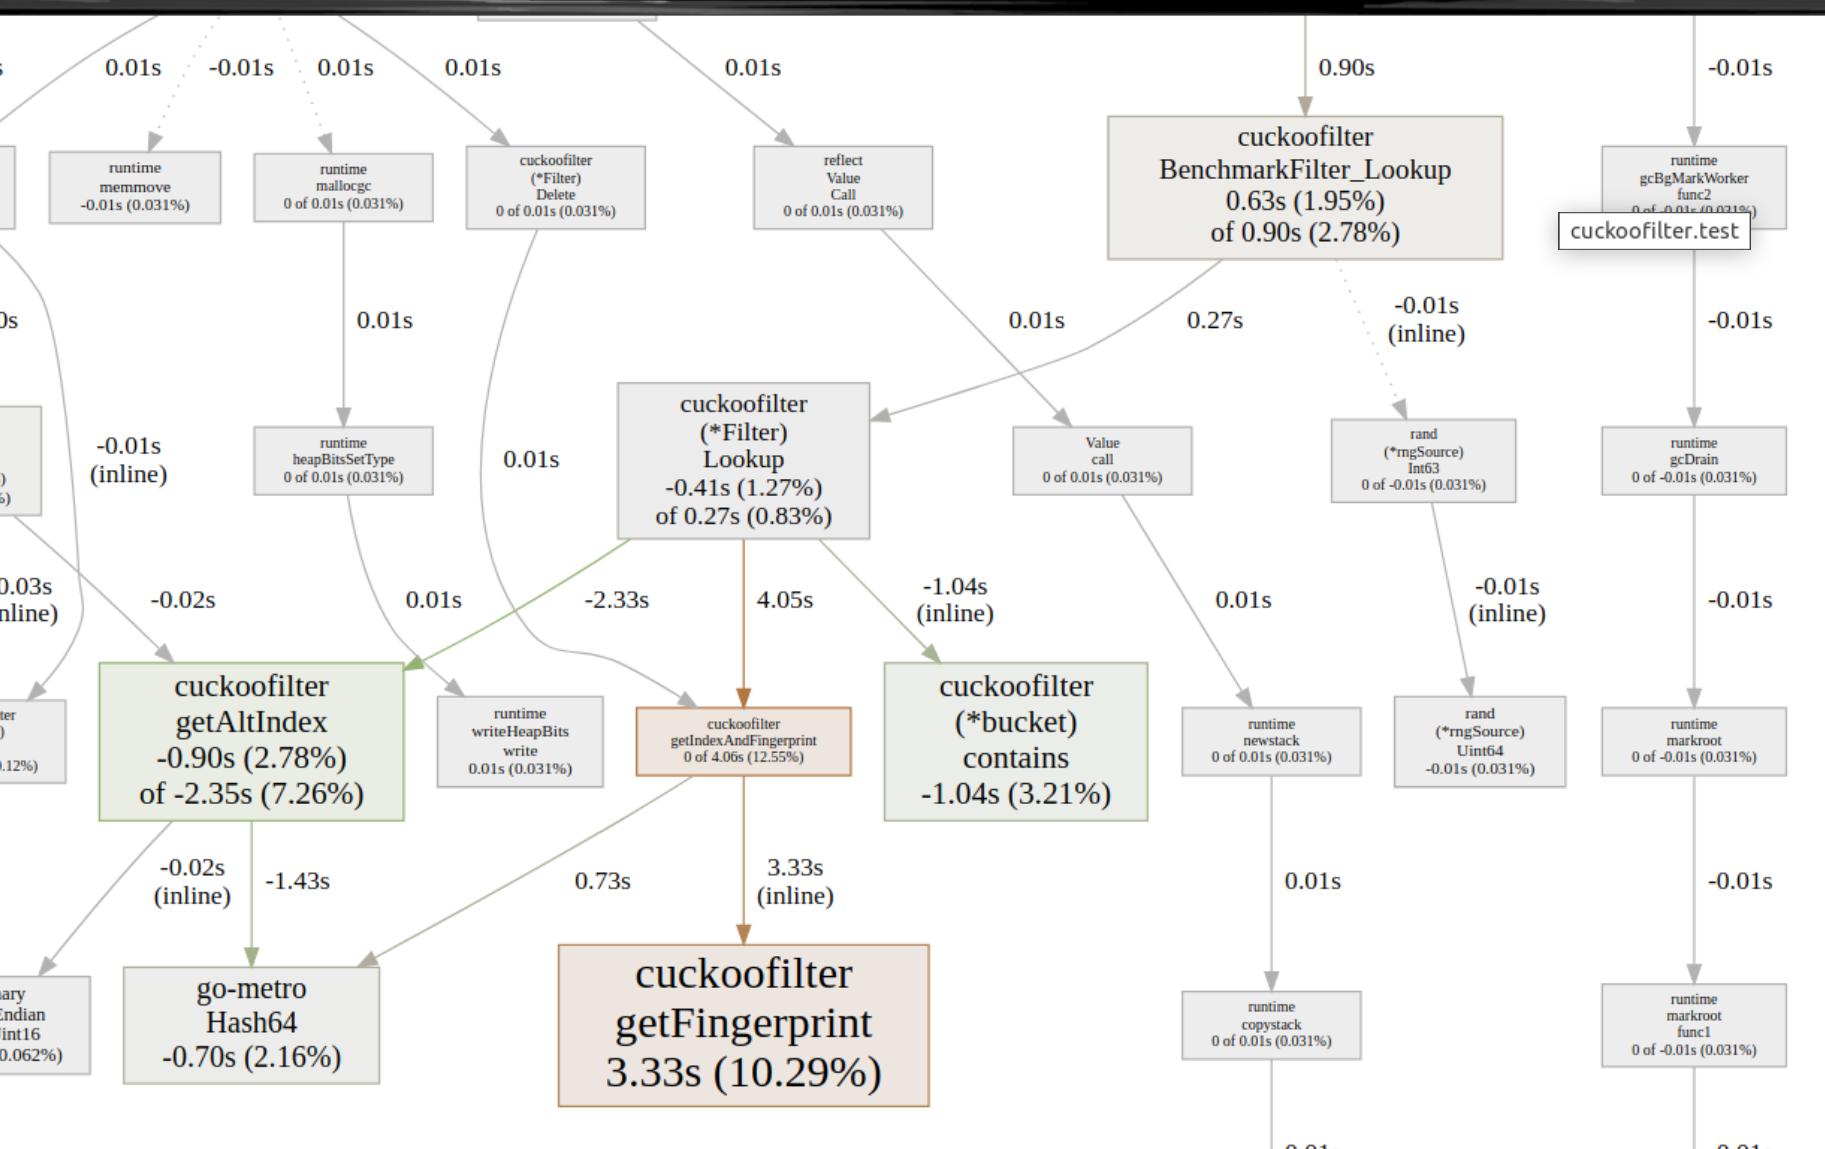
And with this, analyzing the regression got easier!
As for the cause of the performance regression: still working on that one…